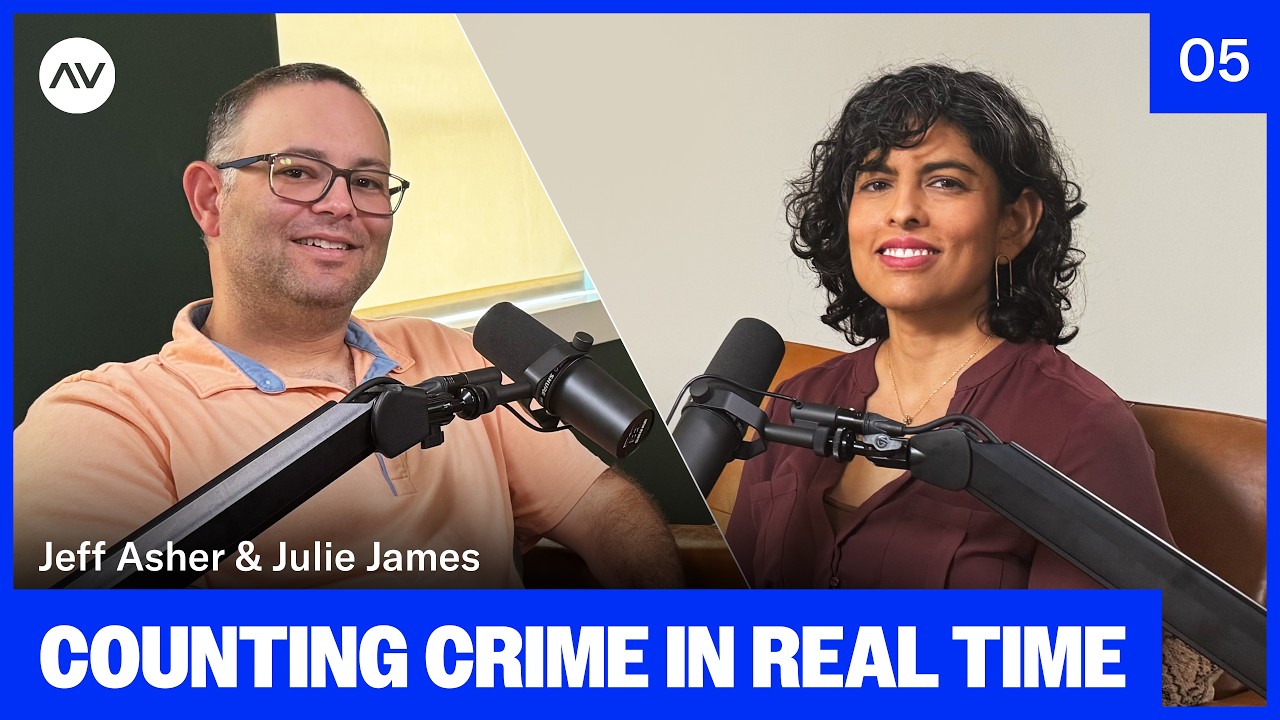
Julie James: Could statistics help make our community safer? Today’s guest, Jeff Asher, thinks they can. Understanding crime trends in America is harder than it sounds. Data is collected inconsistently, reported late, and often incomplete, which makes it difficult for policymakers and communities to respond effectively.
Jeff was at the CIA and the New Orleans Police Department before moving into research. He’s the creator of the Real Time Crime Index, an ambitious attempt to give America an accurate, up-to-date picture of what’s actually happening. We talk about what the data shows, the challenges of collecting it, and why he thinks better statistics could lead to better outcomes.
I’m Julie James, and this is Field Notes.
Hi, Jeff.
Jeff Asher: Hi.
Julie James: You’ve been working with data for a while, but I wanna start with real-world impact. Can you give me an example of where you’ve seen data translate to having an impact on public safety?
Jeff Asher: So I think the best example is, I’m in New Orleans and, born and raised here, and was… When I first started consulting, one of my first clients was the New Orleans City Council working as their public safety consultant.
And when I say, talk about New Orleans, I always talk about it like Rick in Casablanca, that it’s like everywhere else, only more so. And so when crime got worse here, it got worse here than everywhere else. When it got worse nationally, it got worse here than everywhere else. When police departments, mostly medium and large-sized departments, started losing officers, this agency, this city lost a quarter of its officers.
So things got significantly worse here than everywhere else in that sort of immediate post-pandemic timeframe. The city went from 125 or 121 murders in 2019 to 266 in 2022. And because of this sort of exodus of officers, they went from about, they had what? 1,200 or so officers and recruits in, at the end of 2019, and they shrunk to about 900 today.
So really dramatic declines. One factor that happened there was that response times went through the roof. So they went from about a 50-minute on average response time to just your average random call to a 180-minute on average response time in the early part of 2023. And this has really, really terrible effect on community trust.
It has effect on, significant tr- effect on the share of calls that officers get to. You know, you’re coming out of a bar, you’re the designated driver, you’re with your buddies, you drive them all home, and you realize that your car’s been broken into. Hey, they didn’t steal anything major. Maybe you had a couple of bucks in the, the glove compartment or something like that.
Either way, your car’s been broken into, you call the police. The police say, “Hey, we’ll get there when we get there.” It’s 1:00 in the morning. You’re tired. You go to bed. You fall asleep. You put your phone on do not disturb. The officer gets to the scene at 4:00 in the morning. They realize that nobody’s there.
They call the phone that called in the, the incident. They call it twice. They leave a voicemail. Nobody responds. They mark it gone on arrival, and so now the onus is basically on you to report it a second time. And so we can see the research clearly showing that as the response times to an incident go up, so too does the share of incidents that are called gone on arrival or unfounded or unable to locate or whatever an agency might call it.
And so, it has–
Julie James: So crimes are going up and crimes are going unsolved.
Jeff Asher: Crimes are going up and they’re getting unreported.
Julie James: Unreported.
Jeff Asher: And so you may actually see a spike, and we saw this in New Orleans, a huge spike in vehicle burglaries in 2022, but the official data showed it flat or even declining a little because officers, the, the share of calls that they were getting to went from like 20% to 40%.
And so
Julie James: And you were able to identify this trend, and so what, what happened?
Jeff Asher: And so we saw this trend. We were able to articulate with the city council the real incredible human cost to this. There were incidents of rape where the victim would call. Because they weren’t in any physical danger at the time, they would get a non-emergency response.
Basically, they would take it from an emergency to a non-emergency, and instead of a 20-minute response, they got a four-hour response, and they were gone. And so you saw these just horrific incidents that weren’t getting actually reported to the police. You saw incidents of domestic violence where, you know, a victim had called multiple times the police, had been seen as non-emergencies, had gotten long response times that had gone on arrival or unfounded as their dispositions.
And then in at least two incidents, the victim was killed by their abuser after several attempts to contact help. So just terrible effects beyond the more mundane, you know, you tried to get your vehicle burglary call taken care of, and it never happened. And so we went to the council. The council does what legislative bodies do well.
They made a stink about it, but they brought forth the discussion. They put pressure on the police department, which initially denied that this was an issue at all. They put pressure on the mayor’s office, and eventually in 2023, the city hired 100 to 150 civilians to take on… You lost 300 officers, so you need somebody to take on those non-essential roles.
They hired a contractor to respond to non-injury traffic accidents, and these two things combined reduced response times now back to that 50-minute average. Even though they’re still down a quarter of their, the police force, they’re able to respond at a much faster rate. And so these problems have all gotten significantly better than they were two or three years ago.
And so I think it was a really effective use of data to solve a really horrific problem.
Julie James: Great example of, you know, how data can drive decision-making, but we need it in the first place. Can you tell us about the Real-Time Crime Index and what it does?
Jeff Asher: The objective, the original objective was to get between 500 and 1,000 law enforcement agencies nationwide, preferably big agencies, because one, it takes forever to be able to know what the national crime trends are.
The FBI in August of this year published its 2024 data.
Julie James: And this year is 2025. 2025. So we’re running over a year behind.
Jeff Asher: Yeah, if you wanna know what happened in January 2024, you had to wait until August 2025, and that was the fastest the FBI had been. To their credit, they were getting faster, but you’re still talking about a seven, eight-month delay.
Normally a 9, 10-month delay, but still a long delay. If you can imagine you’re waiting to see who wins the World Series, you’re not gonna wanna wait until May of the following year. You wanna know then.
Julie James: This is in contrast, too, to labor statistics. I mean, we have done this before as a country.
We can get more recent data.
Jeff Asher: I don’t know of any other field where– And it’s bizarre when I’m asked, like, “Well, why is it important to know crime trends fast?” What other field exists that we’re, “Okay, we’re gonna wait six months and then make our decisions based on what the data tells us was happening 18 months ago”?
So, the Real-Time Crime Index is designed to answer the question of what are our trends, both at a local level, state level, and a national level. The idea being that if you get enough agencies, 500 to 1,000 is kind of the goal, you can, within probably a percentage point to two percentage points, predict what the FBI data’s gonna show.
And so we can basically tell our trends rather than having to wait eight, 10, 12 months until that month is over, we can show these trends as they’re occurring. And so we publish on a month-and-a-half delay, so in, you know, mid-August, we publish the June data. Mid-September, we’ll publish the July data. So it’s a way to evaluate the trends as they’re occurring.
And so, now we’re at 550, 548 agencies. It covers about 113 million people, so more or less about a third of the country. There’s 18,000 law enforcement agencies nationwide. So from… Oh, God, I don’t wanna do math here. Whatever 500 divided by 18,000 is, it’s a very small percentage of the total number of agencies, about a third of the population, and about half the murders that occur.
So we’re really basing our assessments of the trends on a very solid, if you tell me what 50% of the murders look like, you can usually, within a couple of percentage points, tell exactly what the other 50% looks like.
Julie James: Yeah, so that’s an incredible, you know, trajectory that you’ve been able to accomplish in a short period.
Jeff Asher: It’s hard, because when you provide a sort of a data infrastructure project or you’re providing analysis out there, you kind of do it assuming nobody’s looking, and you only hear about it sort of after the fact. So, one of the examples that I think really comes to mind is we, when we were working with the Real-Time Crime Index, we were… One of the things that we do is we audit the data.
So the data comes in. It’s just a problem with crime data. Frequently, it’s bad. And so part of our process is because we don’t want to constantly be understating what the crime trends are, you go through each data set that you’re getting and a little more complicated than eyeballing it, but essentially eyeball it and make sure that you’re not reporting a 90% drop in all crime for this agency that’s probably a data reporting issue, not an actual crime is changing issue.
And so we did… We were doing this, and we came across an agency, Columbus, Ohio. We’re getting the data. The State of Ohio actually sends us the data, so every month they send us the dataset that the agencies send to them, and we put it into the Real-Time Crime Index, which I assume we’ll talk about later.
But we were coming across Columbus’s data, and it showed all of a sudden at some random month, there was this big drop in everything. Across the board, 70, 80% drop. And so we went to Ohio, went to Columbus, and we got connected, to somebody within their agency, and we said, “Hey, we can see that the [00:10:00] data that’s being submitted to the state is bad.
Can you submit us the good stuff?” And they said, “Wait, what?” The data’s bad. And so we had these conversations. We showed them our charts. You know, you can look, it’s at this level, and then all of a sudden it drops off a cliff. And so they did the research. They went through their system and found that there were errors in how reports were being, going from basically the officer submitting the report to the supervisor.
It was creating this backlog of tens of thousands of cases over a number of years that had sort of reached a head. And so now all of a sudden they were having this enormous artificial drop in crime. We told them about this problem. They went in and they fixed it, and then they said, you know, “Hey, look, we’ve found this problem.
We have fixed the problem, and now the backlog doesn’t exist, and we’ve… The data that we’re being able to submit and show people about and to inform the public about our public safety is now fixed,” and it was only fixed, I think, thanks to the kind of work that we’re doing just to make sure that the data looks right.
Julie James: Yeah, which is really important for public trust–
Jeff Asher: Yeah …
Julie James: in the data.
Jeff Asher: Entirely. And you don’t want to necessarily be submitting bad data. You don’t want the public to be aware of, you know, a 70% drop when it’s actually a 10% increase or whatever it might be. You want… I think crime data’s important because if we want policymakers to make smart decisions, they have to start with a: “This is what the data actually tells us.”
And so when the, what the data actually tells us is influenced by data reporting issues, by errors, by anything, then you’ve sort of eliminated the ability of policymakers to make smart decisions. And I also think you’re also, the, the public perception is also important because if the public d- doesn’t perceive what the actual data says, then the public isn’t in a position to put any sort of pressure on policymakers.
And at a local level I think it can be really effective for when the public sees a spike in carjackings or the public sees a big drop in murder, to be able to pressure or reward the policymakers for what is actually happening that might be in response to policies that they’re implementing.
Julie James: Somebody might wonder, why is this so hard?
You know? Why does it take so long for the FBI to get the information out? Why are you in a position of having to go kind of, you know, agency by agency to help them speed up the process? Take us through kind of the data collection process and some of the hurdles.
Jeff Asher: So let’s go back a century. In–
Julie James: Yes.
Jeff Asher: 1927, it’s funny because so much of this applies today essentially, and, 1927 a bunch of police chiefs get together and they say, “The public thinks crime is surging. We need a system to basically collect the data.” We’re in this position where police departments and the public all are saying that everything’s out of control, and yet the organizations with the data, the police, don’t have any sort of systematized way of presenting it.
And so they created the Uniform Crime Report, ironically as a way to counter the narrative in the public and in the media that there were always crime waves. And so they did it, but they did it in a way where it’s all voluntary. And so since the 1930 first publication, it’s been voluntary. And what that means is that the, the number of agencies that report every year, the agencies that don’t report, the agencies that report but have reporting errors The speed at which agencies report, they’ve got a, they have to report by April of the following year.
So they can report monthly, they can report daily, or they can report at that all at one point. And so the speed at which this happens is very slow because there is no standardization and there’s no means for the FBI to compel agencies to report that data to them. Fast-forward to now, we’re actually getting faster.
We’ve reached a point, the FBI transitioned to a new system called the National Incident-Based Reporting System in–
Julie James: NIBRS.
Jeff Asher: Yeah, they… so it’s a system that’s actually been around since the ’80s, but they forced every agency to transition to it in 2021, and it’s forced agencies to modernize how they report data.
So some agencies are reporting data daily to their state, and the state will report that daily to the FBI, and the FBI earlier this year actually started reporting everything that’s in their holdings. So it’s monthly data. It’s been great for us. We added, like, 110 agencies from that. So a quarter of our agencies are just because the FBI’s publishing the monthly data, but it’s complicated and a lot of times because agencies have until April the following year to report, the data’s not always good.
And so you have to be wary of publishing this sort of cliff of, okay, we’ve got a regular number of offenses that occur, and then all of a sudden we see this enormous drop-off. That’s just a reporting thing. That agency is not up to date in reporting. And so it, the speed with which the raw data is becoming faster, the speed with which the trend is known is not inherently helped by any of this.
And so I think what the Real-Time Crime Index does is it basically steps in and provides a translation from the raw data that’s publicly available from lots of places in ways that it’s never been before to this is what the trends looks like, and it communicates to policy makers and to the public exactly what the trend is.
Julie James: So it’s like a platform where people can access both the information and the analysis that y’all are putting together.
Jeff Asher: Yeah, exactly, and we’ve hopefully done the sort of legwork of removing the data that’s bad, of not including agencies that aren’t complete, and of standardizing. One of the issues with the way the FBI’s reporting data is that they’re reporting when they have this document you can download that shows the, in theory shows the percent change, but really it’s the 12-month percent change versus 12 months the previous year, and it’s of agencies with six common months.
So if an agency only reported three months of data, they can be included. If they reported three months the previous year, if they reported six months of data, they could be… So it’s not exactly apples to apples. It’s very confusing if you actually wanna use it, and so what we do is we basically make it less confusing.
We standardize the time period. It’s all of the agencies that have data through June 2025, and they have every month from June or January 2017 through June 2025, then we can see monthly data, we can see trends, and we can put it all together and evaluate exactly what’s happening.
Julie James: Yeah. I mean, I think people might be Surprised to know that this is a new thing that’s happening and that we didn’t always have this.
But, you know, I think to get a little bit of the texture, could you walk through, like, somebody maybe places a call or somebody witnesses something happening. How does it actually happen from the incident through to showing up in the Real Time Crime Index?
Jeff Asher: We know from the Bureau of Justice Statistics that the share of crimes, we’re gonna put murder to one side because it’s a survey and you obviously can’t survey murder victims, but everyone else, the share of those crimes that gets reported really varies from auto theft because you need the insurance claim you need the police ticket number.
Those get reported at, like, 80% every year, to things like, you know, random thefts. You’re talking about a third of them. Rape and other sexual assaults get reported about a quarter of them. So we know that things get under-reported to the police. If you’re the victim of an incident and you decide to call the police, it goes through their, essentially their calls for service.
So it goes to 911 if the officer doesn’t witness it. If the officer witnesses it, you sorta circumvent that. But assuming that you call 911, the officer gets there. Assuming they get there, they find you there, they take your report, they find your report credible, then they write up a report in their records management system.
They assign it to one of the criminal types. So, you know, you’re a store and somebody shoplifted, so you call one of the theft categories is shoplifting. The officer gets there. They write up the… You know, they look at the surveillance video. They write it up. Maybe they make an arrest. More often than not, they don’t.
And they, put it in the records management system. The agency takes all of that, and they submit it. It used to be they just aggregated it and they send it to the FBI. Now they actually, National Incident Based Reporting System, they actually send the incident cab- all this information they’ve collected on the incident up to their state.
Every state but Mississippi has a state UCR program. So all of these states take the data, and they put it together. They package it. They do their own reporting on it. They audit it importantly. They… But nobody audits it for qual- like, correctness. They all audit it for process. So did the agency do the right things?
Were all the forms filled out correctly? And then they send that up to the FBI. Some agencies, some states do that daily. Some states do that weekly. Some states, as we were talking about, do it infrequently. They send it to the FBI. The FBI takes it. They aggregate everything. They make their estimates.
They, because right now we’re at about 95% of the population, the US population is covered by an agency that reports each year. So they have to estimate that other 5%. They do those estimates and then they publish their data. So it takes a long time. The most precarious part of it is between when, you know, the crime occurs, the victim decides whether or not they wanna report it.
If they report it, can they do it, report it correctly? And then if they get there, does the officer get there in time and do they identify the offense as exactly what it is? Because you’ve got– From that point, it’s much more sort of standardized what happens, but there’s a lot of things that can come in from an actual offense occurring to the offense being correctly reported.
Julie James: So we’ve heard about why we’re not getting information fast enough. How did you go about setting up the Real-Time Crime Index?
Jeff Asher: So it started with a lot of crazy promises. Honestly, our initial thought was this is gonna be a networking challenge.
We’re gonna meet agencies. We’re gonna meet states. We’re gonna get them to start sending us the data, and we were successful in some of that. We’ve got a handful of states that send us the data. We’ve built relationships. But very early on, we noticed that a lot of the data is just available, either through public records requests or through agency portals or through state portals.
And so there’s about 15 to 20 states that actually publish the data, and they publish it as it’s occurring. So we can… Texas is a great example. San Antonio publishes the first couple of days of each month, so by, you know, February 3rd, their January data is published. And so you can go out, and you can get it, and you don’t have to build a relationship with San Antonio, and you can do that.
Texas is enormous. There’s 80-something agencies that we’re grabbing data from Texas. And not every agency reports properly every month, but we’re able to go out and get that. And so honestly, it’s just been a, slog is the wrong word, but it’s a battle to go out and find agencies, and we got sort of that initial…
I think when we first launched, we had 304, 305 agencies, and then go out and finding more agencies and finding more states and expanding our coverage that way. And then now that we’ve got the FBI monthly data we’ve built scrapers that go out and get the data, bring it back, and then we’re able to audit it and get it that way.
So there’s not one, like, aha moment, but it’s been getting what was available, and then each month we’re able to add more agencies and more data.
Julie James: But no one else has done this. So why hasn’t someone taken on this challenge before? What’s different- … about now or maybe you?
Jeff Asher: Because it’s a pain in the butt is why. I mean, it does- it takes a consistent commitment to, one, collecting it, standardizing it, auditing it. It’s not something that would have been possible without the work with, from Arnold Ventures and the ability to partner and to set up a team that could do that.
I think the better question is not why hasn’t someone, but why isn’t the federal government doing this? It does seem like something that the federal government should be doing. The long-term vision of this is that we’re able to get it to federal ownership, transition it to where the federal government is running this because it should be a project that we think is something that is a public good.
And so, you know, there’s no subscription costs. There’s no… Nobody… We’re not asking people to donate or anything like that. The goal is to create a public good that really should be publicly available. I think that part of the reason it hasn’t happened till now is that the data has not been updated with enough frequency.
I mean, with the NIBRS transition, it was a pain, but with the transition has come a real increase in the number of states and the number of agencies that are publishing their data. And so really in the last four or five years, the ability to go from, you know, 10 years ago you could probably get in 50, 60, 70 agencies.
Now we can get 400 without the FBI and 550 with them. So it’s something that we’re in a position to do where you’re able to get to that scale where you know what you’re doing is right, and you’re not talking about a 3 or 5% margin of error in terms of what you’re predicting the trend is. You’re talking about a really small one, and you’re a lot more confident that what you’re getting is correct.
Julie James: Yeah. Well, and I’ll say for a project like you put out in the world, part of the hope and why we support projects like this is that, innovating and, trying things out and taking the risk out of, something like this is one way that we hope that, the federal government will then take that on later.
It’s hard to move in those spaces, as you know, former fed, former fed here. And so, you know, the role as we see it of philanthropy is really trying to, you know, de-risk big moves like this. And yeah, I hope too that they’ll take it on. There are reasonable questions out there about the accuracy of the data.
There may be skeptics who say, “You know, I’m seeing crime.” And you mentioned revisions as well. So what’s the value in using immediate data versus waiting? What’s your approach to looking for trends amid the uncertainty?
Jeff Asher: So I like to sort of compare this… I’m a big baseball fan, and I was in Chicago recently, took my seven-year-old to Wrigley Field.
I’m a big Nationals fan, having been in DC, right? Lived right near the ballpark. So they were playing the Nationals, and so we went to a game. We were watching the next game on the way back, and the Nationals were down, they were down three to one in the ninth inning.
Julie James: Sounds familiar.
Jeff Asher: Yeah. Well, then their number nine hitter hit a home run, and then they got two more men on, and then the next guy hit a home run.
And I went to, there’s this website, Baseball Savant. It’s run by the Major League Baseball, and you can see as these, as the game is happening [00:25:00] everything about the pitch. So where the pitch location was, the speed, the spin rate of the baseball, the exit velocity after the batter hits it, the launch angle, and they’ve got this great feature where they tell you for a home run what…
or for pretty much any ball that’s hit in the air, what share of ballparks would it have been a home run in? And so the Nationals hit two home runs in the ninth inning. They won six to three, and there was one ballpark in all of MLB- Yeah … that both home runs would’ve been a home run in, and obviously it was Wrigley Field.
So within minutes of this happening, you could see this, this incredible amount of information, precise information. With crime data, you don’t get any of that, and you don’t get that from the FBI data, even though you’re waiting for seven or eight months from, for a year to end to get it You don’t get that level of precision from our data as well.
We talk about crime data not in a precision role, but in an accuracy. So we can accurately portray what the trends are. We can- we know that murder is falling. We know that pretty much everything is falling right now. Five years ago, if this had been running, we would have known that murder is rising, that auto theft is rising, [00:26:00] that all of these problems were getting worse.
Now we know that they’re all getting better, and we can accurately portray the trend. We have murder through June down 20%. Maybe that’s 19%, maybe that’s 21% when the FBI reports its data next year, but if it’s 6%, I’m gonna be very surprised. We’re very close to what that number is. So when I talk about the accuracy versus precision, there’s real value in knowing exactly what’s happening, even if we don’t know the precise numbers that are happening at any one point.
Julie James: So you know big trends, you know kind of orders of magnitude, you know which direction things are going.
Jeff Asher: And you can evaluate policy. You can identify the need for new directions. You can identify places that are succeeding that you maybe wanna learn lessons from, places that aren’t succeeding.
And the bottom line is, a big Jim Carrey fan growing up, and you know, Whose Line Is It Anyway, where he says the points don’t matter and it’s all made up. It- to some degree, a lot of crime numbers are similar in that we know the number of shopliftings each year that gets reported is gonna be less than a third.
So the number that’s reported by the FBI is… It’s not made up, it’s the number that was reported, but we know that there were far more of these incidents than actually occurred than got reported to police, and that eventually got reported by the FBI. So there’s no, at least in my opinion, it- there’s less of a reason to wait, because waiting for more precision is not gonna actually get you more precision.
It’s just gonna delay reporting basically what we’re able to say right now.
Julie James: Yeah, so I hear that, and that makes me wonder if people can trust the data at all. So what makes you confident, even with that, you know, you don’t have that complete picture, how can people trust that the data’s not being fabricated?
Jeff Asher: Well, so the advantage of working in the tens of thousands, the hundreds of thousands, the millions of incidents across a thousand, 10,000, you know, 18,000 agencies, is that the likelihood of… You know, we’ve got this system that is not standardized. It is not a federal system. It is a voluntary reporting system.
So by applying standardization to everything, we’re kind of, I mean, I guess there, there could be a mass conspiracy across tens of thousands of agencies, but, you know, as a former fed, you know that the likelihood of, like, being able to build that vast conspiracy is virtually nil. And so I think that the data we can accurately show that our data is predictive of the trends, usually within one to two percentage points of what’s going to be reported.
And so we know that the, the data itself is trustworthy, that the trends are trustworthy, even if we know that we’re only reporting half of the murders that have occurred this year. If we’re reporting half the murders that have occurred so far this year and the year’s halfway over, then we’re looking at a quarter of the murders that will occur this year being in our sample set.
But that is sufficiently large, history has shown us, ’cause we can go back and we can say, “This is what the FBI said in 2024, and this is what our data said,” and they were matched up almost identical.
Julie James: It’s like the same kind of math that, like, when I’m playing fantasy football, it tells me my probability–
Jeff Asher: Yeah
Julie James: because it’s based on so many, you know, so much data.
Jeff Asher: You’ve got so much data there, the ability to fabricate it is virtually nil. And because we’re auditing the data, if things don’t look right, we’re in a position to, to see, like with the Columbus example, of this doesn’t look right, we’re not gonna include it.
And so really the, the fear of the project is in taking a data set and each time you publish, the most recent month is well below where other months have been. And it’s well below where it should be seasonal, it’s well below the trend. That suggests that you’re dealing with under-reporting. And so that’s the real fear, is that you’re telling people that crime is a lot less than it is.
And so frequently with this we’re… it’s, we’re conservative in terms of what agencies we include and what agencies we kick out because the last thing we wanna do is show that there were, you know, a 30% drop in crime in June 2025 and then the next month we go back and we revise it and actually crime was up 2% because then you lose trust.
And so trying to maintain that accuracy as you go on is, I think, one of the critical challenges.
Julie James: Yeah. So there’s like a quality control built into–
Jeff Asher: Yeah…
Julie James: what you’re doing.
Jeff Asher: Yeah, it’s… And we, we have an audit algorithm that we run, and then I hate to say it’s an eyeball, but it’s an eyeball.
Because we’re only looking at now 500 and something agencies, you can do that. If you’re looking at six months of data for 550 agencies, like that’s not a terrible… Just to make sure that everything looks like you’re not seeing massive under-reporting.
Julie James: Yeah. So it sounds like, you know, you’ve got a good cohort right now, and there are other agencies that, you know, might be saying like, “This would be really great to have this information, but it sounds daunting.”
Are there good examples out there that you can point to to say, you know, “This is actually doable”?
Jeff Asher: I’d like to think all of our agencies prove that this is doable. We–
Julie James: An exemplar maybe.
Jeff Asher: I mean, we- I don’t know that this is a necessarily a good example, but we’ve talked to states that have been very hesitant to participate, and to send us their data, and then they’ll run a, so we’ll submit a FOIA request for the exact data, and they’ll send us the data, and I think that at least shows them that they can plausibly do it.
I don’t know that we’ve necessarily run into states where if… We learn very quickly when we’re talking to an agency or a state whether or not they’re gonna wanna participate because you talk to the… Very few times have we gotten, and we have gotten states that are like, “This is a great idea. We love this.
We can’t do it because we just don’t get the data fast enough.” Other states or agencies, we’ll talk to them, and if you talk to the wrong person, they say, “No, we’re not gonna participate.” And you talk to the right person and they say, “This is great. Let’s do [00:32:00] it.” There’s very few, I think, that we sort of have to walk through the process.
Usually they self-select pretty quickly.
Julie James: You mentioned Texas, and I think it was San Antonio?
Jeff Asher: Yes.
Julie James: How do they do what they do?
Jeff Asher: So this is the challenge. They’ve got… They’re on NIBRS, so they’re collecting it every day. They just–
Julie James: And that’s, like, the newer version of–
Jeff Asher: That’s the newer version…
Julie James: FBI.
Jeff Asher: Yeah, and then they’ve got the records management system. Every month, the first couple of days of the month, they just send the data over to the state. The challenge and the reason that we have a 45-day delay is that usually the last couple of weeks of a month, the, maybe the last week or so, the agency has not completed everything.
So not every report has been through a supervisor. Not every report is completed. Not every report is in the system. And so when they submit it the most recent month, so when they submit their, September 2025 data, when they set submit their data in September 2025, the August data will not totally be complete.
The last week or so, you’ll see sort of this cliff that I’ve been talking about where they’ve got 90% of the incidents on the 24th of August to 10% of the incidents on the 31st. So but when they submit their September data in October, they will correct everything that happened in August. So that’s why basically we give them until that extra week and a half plus a month in order to catch up and do that.
So it’s, technically it’s very easy for pretty much any agency that’s sort of got this system set up. I don’t want, need to go through the intricacies of the technology, but any agency that’s set up could do this. A lot of agencies don’t necessarily have the processes in place to say, “Yeah, let’s just do it that first week, and that’s that.”
Julie James: So you put this thing out in the world, and people are really responding. What are the ways that people are using the Real-Time Crime Index, whether expected or unexpected?
Jeff Asher: Certainly I’ve seen it in a ton of reporting. You know, a lot of places, the, the Associated Press has now started when talking about X crime, they’ll use the RTCI as sort of their, this is what the trend shows in the Real-Time Crime Index.
See it in reporting coming from states. The state of California has used it to discuss what the state’s crime trends are so far this year. Have seen it in research papers and in academic papers, which is great to see. The Biden White House used it in a couple of reports, which was again, wonderful to see as well.
And, I will say the most unexpected place that I sort of saw it is the current FBI director, Kash Patel, went on Joe Rogan’s podcast and was claiming credit for a 20% drop in murder, where or not credit, but he was claiming that the FBI had put out that there was a 20% drop in murder, which was in response to what the Real-Time Crime Index was showing through May of that year, and the FBI hasn’t put out any data on this.
But he was talking in, and he, you know, goes through his talking points and is like any politician, is claiming credit and whatnot. But to see that used, through the, you know, through the FBI leadership, I think has been unexpected and, certainly welcome any uses that wanna acknowledge what the trends are.
Julie James: What do you caution as the limitations? Like, what are the blind spots? What could the data miss? Or how would you not want people to use the index?
Jeff Asher: So I don’t want people to use it to compare. And I know people are gonna… I’ve seen it used on places that are real estate sites that are saying–
Julie James: Comparing what to what?
Jeff Asher: Compare cities to cities, comparing data sets to data sets. It doesn’t necessarily always line up apples to apples. So you can compare one city’s data to itself, but comparing… And the FBI has this lengthy document that they put out about [00:36:00] why people shouldn’t compare. And, you know, you have the, St. Louis is a good example, a city of a couple million people, but the actual city itself is only 270,000 people or something like that as far as what gets counted. And so that creates, somewhat artificially, this enormous crime rate in St. Louis because it’s only this tiny portion of the city that gets counted versus other places where 90% of the metro area is part of the city borders.
Julie James: I see. So the crime that’s counted is, like, divided by the small population, and then that makes it look like it’s a big–
Jeff Asher: Yeah, exactly.
Julie James: Great. Okay.
Jeff Asher: And so, there’s other places. New York, I think, reports felony assaults rather than aggravated assaults, so we’re accurately measuring the trend, but the exact numbers that they’re gonna be reporting to the FBI is lower in the real-time crime index than it is than what’s gonna go to the FBI.
So, you know, we’re sort of artificially lowering New York’s crime rate by doing the data that they have publicly available. We’d love it if they’d send us their aggravated assault numbers, but we just don’t have that. So that is a challenge, not necessarily one of the places that I, like, don’t- I would rather people not compare, but I built a system where you can look at everybody’s crime rates, and so it’s, you know–
Julie James: It’s tempting.
Jeff Asher: We didn’t make it easy for people to compare, but you can download the data and do it yourself… if you wanna do that. I think the other limitation is that it’s not complete, that an agency may report 120 thefts in June of 2025, and then when they update their data next month, it might be 135. They may have had a bad month in terms of, like, their revision, or they might have…
Usually, it’s about where we are now is about 1% below for each agency where it will be. So if they reported 100 thefts, that may actually be 101 in that month, sort of on average. Which is pretty good, I think, for doing it. That’s the- that is the, the cost of doing it fast, is that we’re not complete. I think the other issue is that we have a- we’re using all cities of 50,000 or more and counties of 100,000 or more within the country.
So a city, a state may only have three or four cities that meet the criteria, or we may only have a handful of cities. California, we’ve got a ton of cities, but California has a lot of cities, and so we weren’t hitting the entirety of the state. And so I don’t want people to say, “Well, in Indiana, you know, murder’s down 18%.”
Well, no, in the four cities of Indiana that meet the criteria that actually have data, then that’s where the, the trend is. So I think that, we have a lot of CYA language on the website, and I don’t know that everybody reads the entire disclaimer every time. But you’re certainly… because we’re not saying what the national crime trend, or we’re not saying what the national crime numbers are.
I’ll see, you know, according to the Real-Time Crime Index, there were 7,281 murders in 2024. I’m like, no, we’re not saying that. We’re saying within our sample, there were that many, and I think people aren’t always careful of sort of differentiating that.
Julie James: So zooming out what are the common mistakes you see people making with data, interpreting data, analyzing data?
Jeff Asher: I think- speaking with too much certainty about sort of like what the numbers show, especially with crime data when we’re doing an analysis of what the nation’s crime trends look like. The FBI used to put out this quarterly data, and the quarterly data was really flawed because it was taking all of the agencies and it wasn’t audited, and it was just here in the first quarter of 2024, here are the crimes, and this is what’s been reported to us.
And they do it with a bit of delay, but some agencies don’t report fully or some agencies report with errors, and so it massively understated what the nation’s crime trends look like. And so it was saying, you know, last year murder was down, what, 14%, 15%? And they… The FBI’s initial quarterly estimates was like a 28% drop, and so it was 20-something percent drop in every type of crime.
And I would see people and they’d say, “Okay, here are the numbers through 2023. Now I’m just gonna add this 25% drop, and look at this incredible drop in crime.” And I think that that was unfortunate that to see sort of this official data source that wasn’t acknowledging the intricacies of the data.
You also see people misuse the survey data, which- it’s a survey. It comes with a margin of error. It doesn’t include murder. Because of the way that the BJS collects the data, it’s not exactly apples to apples. It’s actually an 18-month sample that overlaps with the previous year. And so all sorts of issues, and I would say, well, the FBI data says one thing, the BJS data says another, and that got complicated.
Julie James: So Jeff, are there things about the Real-Time Crime Index or more generally in this space that you’re hopeful about?
Jeff Asher: I mean, I think that it’s getting, certainly getting more use. I hope that it’s getting acceptance. I, we’ve… It’s cool that we’ve hit our goal, and are able to be in a position. I know that we’ll–
Julie James: And what was your goal?
Jeff Asher: How many agencies? The goal was 500 agencies, which was an artificial number, but it was also a, if we have this many agencies, we feel really good about what the trend, the accuracy of the trend. And so to have like made that promise initially and to actually hit that and to see that it’s actually doing what we thought it would has been great.
One of the new aspects of the project is we’re gonna relaunch either, probably not the end of this year, but the start of next year, as the Crime Index, and we’ve gone through historical data. The FBI has, in PDF, scanned in PDFs data back to 1930, back to its first reports. And so if you wanna know how many murders in Boston there were in 1932, you have to find the PDF through archive.org and get to it, and so we’re digitizing all that data.
We’re gonna have the crime clearance rates, staffing data, and so you’re gonna be able to see an agency’s data from 1930 essentially to six weeks from today, so six weeks ago. So, in a project, and then the other aspect of that is launching much better communication. So we know that people are bad at perceiving crime trends, and so now that we’ve built the tool to be able to actually show them accurately, we wanna be able to communicate that more effectively so that when people think, “Is crime rising or falling?”
They don’t rely so much on the anecdote. So we have a YouTube channel aggregated that just launched that we’re creating regular videos for. We’re gonna be stepping up our social media game. I’m starting a podcast very shortly that will, called the Jeffalytics Podcast, which I will avoid blushing about.
But the, the goal is to… it’s entirely focused on what are their perceptions of crime, why do these, why the perceptions not hit the reality, and one, what can we do about it? And then talking to people, what are they doing about it? And so already done a couple of interviews for that and recorded a couple of episodes, and they’ve been really great and very excited for that.
Julie James: Oh, that’s fantastic. I… It’s a hopeful note to end on that we hope we can have a shared understanding of at least what the problems are so we can get some solutions going.
Jeff Asher: Yeah.
Julie James: Well, thank you so much, Jeff. If people wanna find out more about the work that you’re doing, where can they go?
Jeff Asher: So the, the Real Time Crime Index, realtimecrimeindex.com, is the best place. I have a Substack newsletter, Jeffalytics Substack, so I think it’s jasher.substack.com if people wanna subscribe, and those are probably… And aggregated on YouTube.
Julie James:Thank you, Jeff. And that’s all we have time for today. Thank you for listening or watching.
Subscribe for more conversations, and we’ll be back soon. Goodbye.